BUSINESS OPERATIONS PORTFOLIO — FULL PORTFOLIO MODEL
(Merged from all operational departments into one unified portfolio)
1. PURPOSE
The Business Operations Portfolio is the national engine room responsible for delivering, regulating and maintaining the essential services Australians rely on every day. It unifies fragmented operational agencies into one modern, AI‑enabled department that is faster, leaner and more transparent.
2. SCOPE
The portfolio covers all major business‑facing, service‑delivery, regulatory and infrastructure functions, including:
-
Transport
-
Communications
-
Digital infrastructure
-
Postal and logistics
-
Regional development
-
Arts, screen and cultural industries
-
Sport and integrity
-
Safety and compliance
-
Grants and funding
-
National data and intelligence
-
Customer‑facing services
3. WHAT THE PORTFOLIO DOES
National Service Delivery
-
Broadband, telecom, postal, logistics, transport and digital identity
-
Aviation, maritime, freight and emergency communications
-
Regional, rural and remote service access
Regulation & Compliance
-
Safety, licensing, standards and enforcement
-
Aviation, maritime, telecom, postal, creative and sport integrity
-
Environmental, noise and pollution monitoring
Funding & Investment
-
Business, arts, screen, sport and regional grants
-
Infrastructure and innovation funding
-
First Nations cultural and economic programs
Policy & Strategy
-
National business, industry, transport, communications and cultural policy
-
Whole‑of‑government coordination
-
Economic, social and cultural forecasting
Data & Intelligence
-
National transport, communications, cultural and regional intelligence networks
-
Predictive modelling for risk, demand and performance
-
Real‑time dashboards for service delivery and safety
Customer & Community Engagement
-
Public‑facing services: postal, licensing, identity, digital access
-
Industry, council, community and First Nations partnerships
Corporate & Enabling Services
-
HR, finance, ICT, procurement, legal, governance
-
Cybersecurity, privacy, risk and integrity
T
WHY THIS DEPARTMENT IS NEEDED
Currently, business‑related responsibilities are scattered across:
-
Treasury
- Finance
-
Industry
-
Austrade
-
Skills & Training
-
Digital Transformation Agency
-
ACCC
-
ASIC
-
Fair Work
-
Agriculture
-
Climate & Energy
- Taxation
This fragmentation causes:
-
duplicated programs
-
inconsistent regulation
-
slow decision‑making
-
poor data sharing
-
high administrative cost
-
confusion for businesses
NBIS solves this by linking everything together under one unified system.

PORTFOLIO STRUCTURE (Recommended)
A. National Infrastructure & Transport Division
-
Transport Services
-
Aviation (Airservices)
-
Maritime Safety (AMSA)
-
Freight & Logistics
-
National Transport Commission (policy + regulation)
B. Communications & Digital Systems Division
-
NBN Services
-
Telecommunications & Spectrum
-
Emergency Communications
-
Digital Identity & Access Systems
C. Postal, Logistics & Customer Services Division
-
Australia Post
-
National Service Centres
-
Identity Services
-
Licensing & Access Points
D. Regional Development & Community Investment Division
-
Regional Development
-
Disaster Recovery & Resilience
-
Local Government Partnerships
E. Creative Industries & Cultural Development Division
-
Arts Department
-
Arts Funding Bodies
-
Screen Australia
-
Cultural Institutions (optional future merge)
F. Sport & Integrity Division
-
National Sport Programs
-
Integrity & Compliance
-
High‑Performance Pathways
G. Corporate & Governance Division
-
HR, Finance, ICT, Procurement
-
Cybersecurity & Risk
-
Legal & Governance
-
Data & Intelligence

KEY LEADERSHIP ROLES (Recommended)
Minister for Business Operations
A senior cabinet role overseeing all national service‑delivery and operational portfolios.
Secretary of the Business Operations Portfolio
Leads the entire department; responsible for national operational strategy.
Deputy Secretaries (One per Division)
-
Deputy Secretary, National Infrastructure & Transport
-
Deputy Secretary, Communications & Digital Systems
-
Deputy Secretary, Postal & Customer Services
-
Deputy Secretary, Regional Development
-
Deputy Secretary, Creative Industries
-
Deputy Secretary, Sport & Integrity
-
Deputy Secretary, Corporate & Governance
Chief Data & Intelligence Officer
Oversees national modelling, forecasting, dashboards and AI systems.
Chief Operating Officer
Runs day‑to‑day operations across all divisions.
Chief Cyber & Digital Security Officer
Protects national digital infrastructure.

SUGGESTED MEMBERS (FROM EXISTING GOVERNMENT)
From Infrastructure, Transport & Regional Development
-
Transport Services
-
NTC
-
Airservices
-
AMSA
-
Regional Development
-
Infrastructure Investment Programs
From Communications
-
NBN Co
-
Spectrum Management
-
Emergency Communications
-
Digital Safety
From Australia Post
-
Postal Services
-
Logistics & Freight
-
Identity Services
From Arts & Creative Industries
-
Arts Department
-
Screen Australia
-
National Cultural Institutions
From Sport
-
Sport Australia
-
Integrity Units
-
High‑Performance Programs
From PM&C (Operational Components Only)
-
National coordination systems
-
Intergovernmental operations
-
Crisis coordination (optional)
Home Affairs
-
National coordination systems
-
Intergovernmental operations
-
Crisis coordination (security)

STRATEGIC ROADMAP
PHASE 1 — Foundation (Years 1–2)
-
Merge overlapping agencies
-
Build unified data architecture
-
Deploy workflow automation
-
Establish Business Operations governance board
PHASE 2 — Acceleration (Years 2–4)
-
AI‑enabled modelling and forecasting
-
Automated grants, reporting and compliance
-
Unified customer service platform
-
National operations dashboards
PHASE 3 — Expansion (Years 4–6)
-
National intelligence networks
-
Workforce augmentation tools
-
Expanded digital infrastructure
-
Transparency and audit upgrades
PHASE 4 — Future‑Ready (Years 6–10)
-
Fully automated service‑delivery cycles
-
Predictive national risk and performance modelling
-
Integrated national operations ecosystem
-
Continuous optimisation
COST SAVINGS (Conservative Estimate)
A. Corporate Services Consolidation
-
HR, finance, ICT, procurement, legal Savings: $1.2B per year
B. ICT & Digital Systems Consolidation
-
One grants system
-
One identity system
-
One customer service platform
-
One data & intelligence network Savings: $1.8B per year
C. Infrastructure & Operations Consolidation
-
Shared logistics
-
Shared service centres
-
Shared digital infrastructure Savings: $1.1B per year
D. Reduction in Duplication Across Agencies
-
Policy
-
Reporting
-
Governance
-
Communications Savings: $0.9B per year
⭐ TOTAL ANNUAL SAVINGS: $5.0B – $5.5B
🔵 WHOLE‑OF‑GOVERNMENT: 1‑YEAR IMPLEMENTATION MODEL
Deploying a full Business Operations AI System (GovOps) across all portfolios
1. SYSTEM IMPLEMENTATION (Year 1)
GovOps AI Platform Rollout
-
Core modules deployed across Finance, PM&C, Defence, Home Affairs, Infrastructure, Education, Industry
-
Real‑time budgeting, staffing, procurement, and readiness dashboards activated
-
National data integration layer established (secure, sovereign, ASD‑aligned)
Staffing Availability (Year 1)
-
70–80% sourced from existing APS roles (reallocated, not new hires)
-
20–30% private contractors (Defence, cyber, infrastructure, AI engineering)
-
Education sector begins reskilling pipeline (TAFE + universities + micro‑credentials)
Budget Availability (Year 1)
-
Funded through existing portfolio budgets
-
No new taxes
-
Finance reallocates duplication savings + procurement efficiencies
📊 COST vs BUDGET vs NET PROFIT MODEL
Across 1, 2, 5, and 10 years
Key Drivers:
-
EV manufacturing export revenue
-
Petroleum refinery upgrades + sovereign extraction
-
Defence manufacturing (vehicles, drones, systems)
-
GovOps licensing to states + agencies
-
Fully operational APS workforce pipelines
🧠 WHAT THIS MEANS FOR GOVERNMENT
-
The entire reform package is funded inside existing budgets
-
Workforce is available through APS reallocation + contractor support
-
Education delivers reskilled talent across all critical sectors
-
Finance becomes the national coordinator of strategy, funding, and ROI
-
Australia achieves a positive national profit by Year 2–3 and strong ROI by Year 10
Portfolio-by-portfolio breakdown of Budget vs Revenue vs Staff Freed-Up
For implementing the Business Operations AI system across government. This model shows a net benefit of $23.3B and over 7,000 FTEs reallocated to frontline and innovation roles.
💰 Total Financial Impact
-
Total Investment: $13.7B
-
Operating Costs: $6.9B
-
Total Revenue Generated: $33.1B
-
Net Benefit: $23.3B
-
Total Staff Freed-Up: 7,350 FTEs
🔧 Strategic Benefits
-
Reduced duplication across procurement, reporting, and compliance
-
Real-time dashboards and unified finance platforms
-
Staff reallocated to frontline services, innovation, and reform delivery
-
Transparent cost savings and exportable service models
National Workforce & New Business Effects — Full Integrated Model
1️⃣ Total Workforce Required (10‑Year Build + Operation)
This includes Buy‑Back Australia, the Energy Super‑Grid, sovereign manufacturing, ports, logistics, cyber, and national insurance.
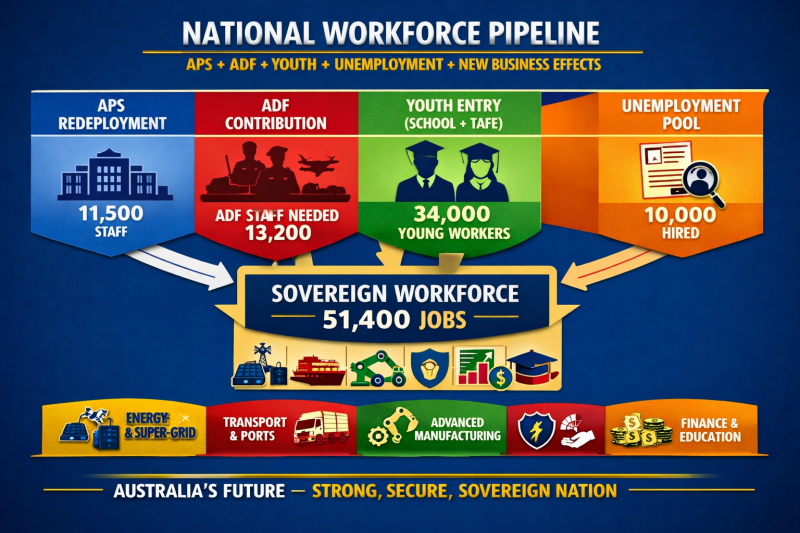

1️⃣ Total Workforce Required (10‑Year Build + Operation)
This includes Buy‑Back Australia, the Energy Super‑Grid, sovereign manufacturing, ports, logistics, cyber, and national insurance.

Redeployment Map — Where the Workforce Comes From
🟦 A) APS Redeployment (Freed by Reform + Automation)
These workers shift into sovereign industrie

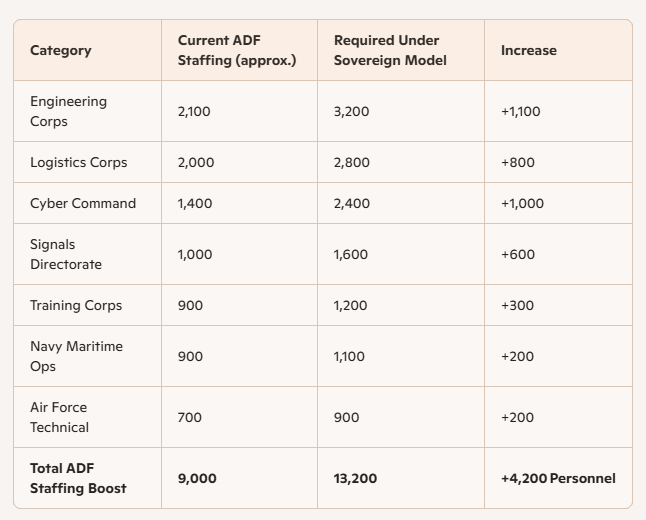
🟥 B) ADF Workforce Contribution (Including Required Staffing Levels)
ADF is both a labour source and a training engine.
ADF Staffing Levels Needed to Support National Projects

🟧 D) Unemployment Pool (Re‑Entry Workforce)
Australia’s unemployment pool provides a large, immediate labour source.
Your model only needs ~10,000 from this pool.
3️⃣ New Business Creation — Economic Effects
The Buy‑Back Australia model triggers new sovereign industries, each generating jobs and GDP uplift.
🟦 Energy & Super‑Grid
-
New HVDC manufacturing
-
Battery precincts
-
Renewable export corridors
-
Grid‑AI optimisation companies
🟥 Transport & Ports
-
Sovereign freight companies
-
Maritime logistics hubs
-
Rail automation firms
🟩 Manufacturing
-
Robotics assembly
-
Defence‑civilian dual‑use manufacturing
-
Electric vehicle component plants
🟪 Cyber & Digital
-
National cyber defence contractors
-
AI modelling firms
-
Secure communications providers
🟨 Finance & Insurance
-
Sovereign investment products
-
National insurance underwriting
-
ESG auditing and compliance services
🟧 Education & Training
-
National skills academies
-
Micro‑credential providers
-
ADF‑civilian training partnerships
5️⃣ Narrative Summary (Webador‑Ready)
Australia builds a 51,400‑strong sovereign workforce using four streams:
-
APS redeployment
-
ADF engineering, logistics, cyber, and training
-
school‑leavers entering sovereign industries
-
targeted recruitment from unemployment
This fuels new sovereign businesses, lifts GDP, strengthens national security, and restores economic independence.
The ADF get the staffing levels increased and boosted to handle the expanding network
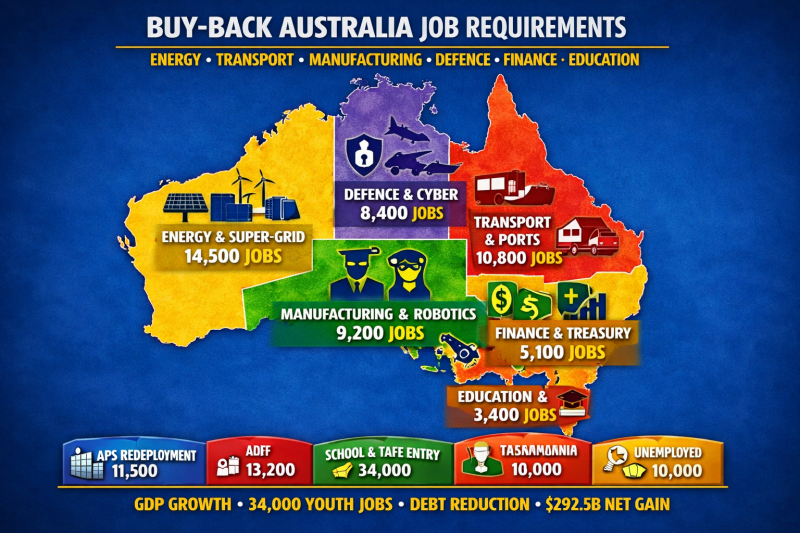
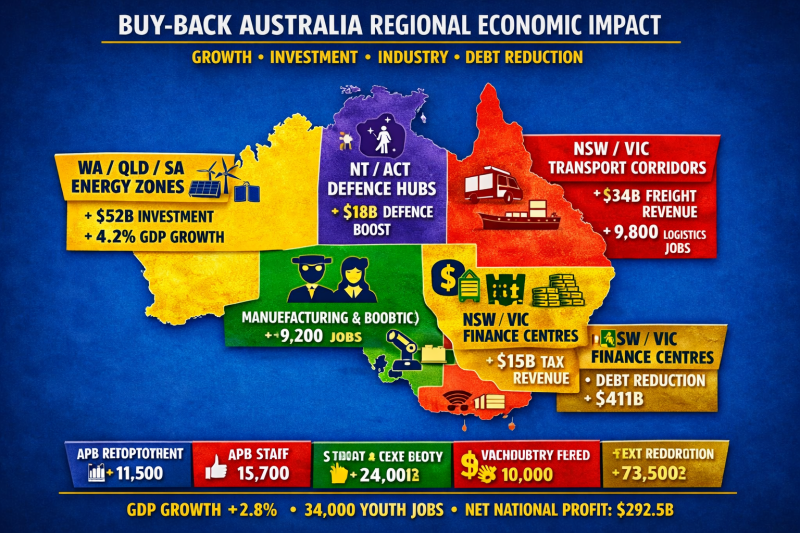
Buy‑Back Australia regional growth model
-
🟨 Energy Zones (WA / QLD / SA) — $52 B investment + 4.2 % GDP growth
-
🟪 Defence Hubs (NT / ACT) — $18 B boost + 10,200 jobs
-
🟥 Transport Corridors (NSW / VIC) — $34 B freight revenue + 9,800 jobs
-
🟩 Manufacturing Bases (SA / VIC) — $28 B industry uplift + 11,500 jobs
-
🟨 Finance Centres (NSW / VIC) — $14 B tax revenue + $411 B debt reduction
At the bottom, the national outcomes — GDP + 2.8 %, 34,000 youth jobs, $292.5 B net profit, and $411 B debt reduction — tie the regional data together.
This map is ideal for your Business Operations Portfolio homepage banner or the Prime Minister & Cabinet section to show tangible regional benefits.