Australia’s National Water & Energy Grid
A Unified Backbone for a Stronger, Safer, Sustainable Nation
Australia is building something no nation has ever attempted at this scale — a fully integrated National Water Grid and National Energy Grid, working together as one system to secure our future. This is the infrastructure that powers industries, feeds communities, protects towns from drought and flood, and delivers clean, reliable energy to every corner of the country.
For the first time, water and energy are being planned, built, and delivered as a single national network, supported by a Civilian + ADF joint mobilisation model that accelerates construction, reduces cost, and strengthens national resilience.
This is not just infrastructure. It is Australia’s new national backbone.
A 50‑Year Nation‑Building Legacy
The Combined National Water & Energy Grid will:
-
Protect towns from drought and flood
-
Power homes, farms, and industries
-
Enable hydrogen, manufacturing, and clean exports
-
Strengthen defence capability
-
Support regional jobs and growth
-
Build climate resilience across the continent
This is infrastructure that pays for itself many times over — economically, socially, and environmentally.
Why Build Them Together?
Water and energy are inseparable. Pumped hydro needs water. Pipelines need power. Regions need both.
By building both grids together:
-
Costs fall
-
Delivery accelerates
-
Benefits arrive earlier
-
National resilience strengthens
-
Regional Australia thrives
ADF engineering units work alongside civilian construction teams to open remote corridors, build access roads, stabilise terrain, and keep the nation moving — reducing delays and unlocking billions in economic value.
A Stronger Australia Starts Here
The National Water & Energy Grid is more than a project. It is a commitment to future generations.
A commitment to:
-
Security
-
Sustainability
-
Sovereignty
-
Prosperity
A commitment to a nation that is connected, resilient, and ready for the future.

A Nation Connected Like Never Before
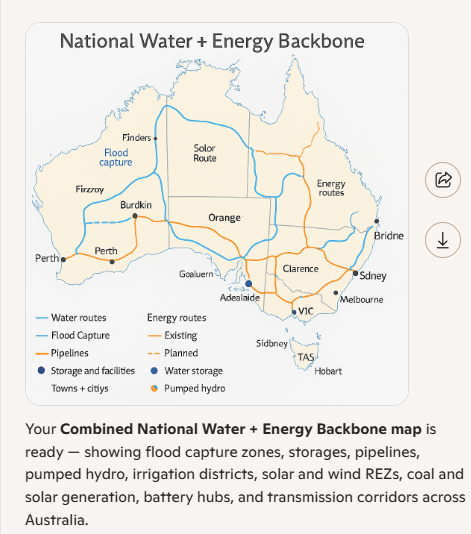
The National Water Grid
A continent‑wide system of:
-
Flood‑capture zones
-
Major storages and off‑river reservoirs
-
High‑capacity pipelines
-
Irrigation and town‑supply networks
-
Pumped‑hydro water feeds
Built to secure water for:
-
Communities
-
Agriculture
-
Industry
-
Environmental flows
-
Emergency resilience

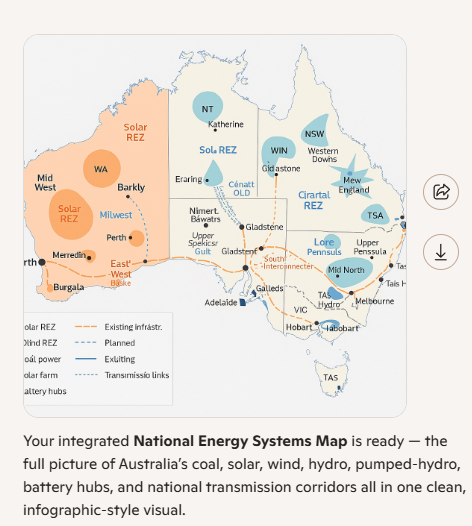
The National Energy Grid
A unified network of:
-
Renewable Energy Zones (solar, wind, hydro)
-
High‑capacity transmission corridors
-
Pumped‑hydro and battery storage
- clean green coal based power stations
-
Coal‑to‑renewable transition hubs
-
Smart‑grid digital control
Built to deliver:
-
Affordable power
-
Grid stability
-
Renewable integration
-
Industrial growth
-
National energy security

WATER ↔ ENERGY INTEGRATION
Energy → Water
-
Powers pumping stations
-
Enables desalination
-
Supports automated water operations
-
Stabilises inland water supply
Water → Energy
-
Provides water for pumped hydro
-
Supports hydrogen production
-
Enables firming for solar/wind
-
Reduces blackout risk
This is where our journey begins. Get to know our business and what we do, and how we're committed to quality and great service. Join us as we grow and succeed together. We're glad you're here to be a part of our story.

1 — National Vision
Title: Australia’s Unified Water + Energy Backbone Content:
-
One integrated system
-
Built by Civilian + ADF teams
-
Powers homes, farms, industries
-
Secures water, stabilises energy
-
Delivers climate resilience
-
The National Water Grid
-
The National Energy Grid
-
A Civilian + ADF joint mobilisation model
-
A 50‑year climate resilience strategy
-
A regional development engine
This backbone delivers:
-
Water security
-
Energy stability
-
Agricultural expansion
-
Industrial growth
-
Defence readiness
-
Climate adaptation
It is the largest nation‑building project since the Snowy Scheme.

Water Grid Overview
Title: National Water Grid Content:
-
Flood capture zones
-
Major storages
-
Pipeline corridors
-
Irrigation districts
-
Town water supply
Core Components
-
Flood‑capture basins (Fitzroy, Flinders, Cooper, Clarence, Lachlan)
-
Major storages (Burdekin, Hume, Dartmouth, Eildon, Ord)
-
High‑capacity pipelines (Northern Spine, Eastern Inland Transfer, Coastal‑Inland Diversion)
-
Irrigation districts (Murray–Darling, Riverina, Darling Downs, Ord)
-
Town water supply networks
-
Off‑river pumped‑hydro reservoirs
2.2 Purpose
-
Secure water for towns, farms, industry
-
Reduce flood damage
-
Increase agricultural output
-
Support pumped‑hydro energy storage
-
Strengthen inland communities

Energy Grid Overview
Title: National Energy Grid Content:
-
Solar, wind, hydro REZs
-
Coal transition hubs
-
Pumped hydro + batteries
-
Transmission corridors
-
Smart grid control
Generation Zones
-
Solar REZs (NT, QLD, NSW, VIC, SA, WA)
-
Wind REZs (SA, VIC, NSW, TAS, WA)
-
Hydro (Snowy, Tas Hydro)
-
Coal transition hubs (Gladstone, Eraring, Loy Yang, Collie)
3.2 Storage
-
Pumped hydro (Snowy 2.0, Burdekin, Tas Hydro, inland PHES)
-
Grid‑scale batteries (Sydney, Melbourne, Brisbane, Adelaide, Perth + REZ hubs)
3.3 Transmission Corridors
-
North–South Spine (QLD → NSW → VIC → TAS)
-
East–West Backbone (NSW/VIC → SA → WA)
-
Northern Arc (WA → NT → QLD)
-
REZ Feeders (dedicated renewable lines)
3.4 Purpose
-
Deliver clean, reliable energy
-
Enable renewable integration
-
Reduce blackout risk
-
Support hydrogen and manufacturing
-
Transition coal regions responsibly

Integration & Efficiency
Title: Why Build Together? Content:
-
Shared corridors
-
Shared logistics
-
Shared approvals
-
Lower cost
-
Faster delivery
-
Earlier benefits
Shared Corridors
-
Water pipelines + transmission lines share easements
-
Reduces land acquisition
-
Cuts environmental approvals
-
Minimises disruption
4.2 Shared Construction
-
ADF builds access roads, bridges, staging bases
-
Civilian contractors build pipelines + transmission
-
Shared logistics reduce cost
4.3 Shared Benefits
-
Water supports pumped hydro
-
Energy powers pumping stations
-
Both support regional industry
4.4 Cost & Time Efficiency
-
6–10 years faster
-
$6–8B cheaper
-
Benefits begin 2–3 years earlier
BENEFIT MODEL (Expanded)
6.1 Water Grid Benefits
-
Agricultural uplift: $15B
-
Avoided flood damage: $4B
-
Regional growth: $5B
-
Climate resilience: $2B
-
Total: $26B
6.2 Energy Grid Benefits
-
Energy revenue: $22B
-
Grid stability: $6B
-
Regional growth: $5B
-
Climate resilience: $2B
-
Total: $35B
6.3 Combined Total
-
$61B (Civilian + ADF)
-
$52–58B (Civilian only)
NET BENEFIT (Expanded)
Civilian Only
-
Net: $6–12B
Civilian + ADF
-
Net: $19.9B
Net Gain
-
$15–20B stronger national benefit
8. BUILD TIME (Expanded)
Civilian Only
-
18–25 years
-
Sequential construction
-
High delay risk
Civilian + ADF
-
10–12 years
-
Parallel construction
-
ADF handles remote + rugged zones
Time Saved
-
6–10 years
9. RISK MODEL (Expanded)
Civilian Only
-
Medium–High risk
-
Weather delays
-
Remote access issues
-
Fragmented governance
Civilian + ADF
-
Low–Medium risk
-
ADF logistics reduce delays
-
National command structure
-
Stronger disaster resilience
10. NATIONAL RESILIENCE OUTCOMES (Expanded)
Water Security
-
Town supply reliability
-
Drought protection
-
Flood mitigation
Energy Security
-
Stable grid
-
Renewable firming
-
Lower blackout risk
Regional Development
-
Jobs
-
Industry
-
Agriculture
Climate Adaptation
-
Long‑term resilience
-
National preparedness
11. INTERACTIVE MAP SECTION (Expanded)
11.1 Map Layers
-
Water Grid
-
Energy Grid
-
Combined Backbone
-
Flood capture
-
REZs
-
Pumped hydro
-
Coal transition hubs
-
Battery hubs
-
Transmission + pipeline corridors
11.2 User Interactions
-
Click nodes for details
-
Corridor timelines
-
Regional benefits
-
Cost overlays
-
Build progress
11.3 Sidebar Panels
-
Corridor specs
-
Storage capacity
-
Energy generation
-
Water volumes
-
Regional impact
11.4 Calls to Action
-
“Explore your region”
-
“Track national progress”
-
“See benefits for your community”
If you want, I can now turn this into a full strategic pla
Economic Impact
Title: Cost vs Benefit (10 Years) Content:
-
Civilian Only: $42–48B cost / $52–58B benefit
-
Civilian + ADF: $36–40B cost / $65–72B benefit
-
Net gain: $15–20B
-
Build time saved: 6–10 years

National Resilience
Title: What It Delivers Content:
-
Drought & flood protection
-
Energy stability
-
Agricultural uplift
-
Industrial growth
-
Defence readiness
-
Climate adaptation
Legacy & Future
Title: A 50‑Year Nation‑Building Legacy Content:
-
Stronger towns
-
Cleaner energy
-
Reliable water
-
Regional jobs
-
Sovereign capability
-
Future‑proof infrastructure

🚆 Road & Rail is inclusive in the Supergrid Costings
✅ Included Components
-
Major Rail Corridors: Inland freight spines, east–west export routes, intermodal hubs
-
High-Capacity Roads: Temporary access roads, permanent freight highways, regional connectors
-
ADF-Enabled Construction: Defence engineers support rapid road and bridge works in remote zones
NATIONAL WATER GRID (Expanded)
2.1 Core Components
-
Flood‑capture basins (Fitzroy, Flinders, Cooper, Clarence, Lachlan)
-
Major storages (Burdekin, Hume, Dartmouth, Eildon, Ord)
-
High‑capacity pipelines (Northern Spine, Eastern Inland Transfer, Coastal‑Inland Diversion)
-
Irrigation districts (Murray–Darling, Riverina, Darling Downs, Ord)
-
Town water supply networks
-
Off‑river pumped‑hydro reservoirs
2.2 Purpose
-
Secure water for towns, farms, industry
-
Reduce flood damage
-
Increase agricultural output
-
Support pumped‑hydro energy storage
-
Strengthen inland communities
3. NATIONAL ENERGY GRID (Expanded)
3.1 Generation Zones
-
Solar REZs (NT, QLD, NSW, VIC, SA, WA)
-
Wind REZs (SA, VIC, NSW, TAS, WA)
-
Hydro (Snowy, Tas Hydro)
-
Coal transition hubs (Gladstone, Eraring, Loy Yang, Collie)
3.2 Storage
-
Pumped hydro (Snowy 2.0, Burdekin, Tas Hydro, inland PHES)
-
Grid‑scale batteries (Sydney, Melbourne, Brisbane, Adelaide, Perth + REZ hubs)
3.3 Transmission Corridors
-
North–South Spine (QLD → NSW → VIC → TAS)
-
East–West Backbone (NSW/VIC → SA → WA)
-
Northern Arc (WA → NT → QLD)
-
REZ Feeders (dedicated renewable lines)
3.4 Purpose
-
Deliver clean, reliable energy
-
Enable renewable integration
-
Reduce blackout risk
-
Support hydrogen and manufacturing
-
Transition coal regions responsibly

COSTING MODEL (Expanded)
5.1 Water Grid Costs
-
Capital: $12B
-
Operating: $3B
-
ADF support: $600M
-
Contingency: $1.5B
-
Total: $17.1B
5.2 Energy Grid Costs
-
Capital: $18B
-
Operating: $3.5B
-
ADF support: $800M
-
Contingency: $1.7B
-
Total: $24.0B
5.3 Combined Total
-
$41.1B (Civilian + ADF)
-
$46–50B (Civilian only)
NTERACTIVE MAP SECTION — HOMEPAGE STRUCTURE
Section Title:
Explore the National Water + Energy Backbone
Map Features:
-
Toggle layers:
-
Water Grid
-
Energy Grid
-
Combined View
-
-
Zoomable map of Australia
-
Clickable nodes:
-
Flood capture zones
-
Solar/wind REZs
-
Pumped hydro sites
-
Battery hubs
-
Transmission corridors
-
Pipeline corridors
-
Towns & cities
-
Sidebar Panels:
-
Corridor details (length, capacity, status)
-
Storage nodes (volume, purpose)
-
REZs (generation type, capacity)
-
Timeline overlays (build phase, operational phase)
-
Cost–benefit popups per region
We offer a range of specialized services tailored to meet your individual needs. Our approach is focused on understanding and responding to what you require, providing effective and practical solutions.

PROJECTED SAVINGS FOR EVERYDAY PEOPLE & BUSINESSES
National Water + Energy Backbone — Civilian + ADF Model
These savings come from:
-
cheaper energy
-
cheaper water
-
fewer outages
-
fewer floods
-
stronger regional economies
-
lower business overheads
-
reduced supply‑chain disruption
Let’s break it down.
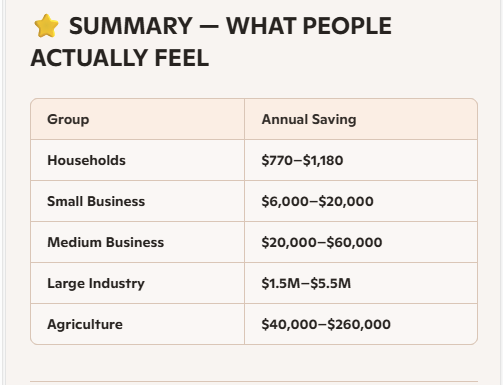
TOTAL HOUSEHOLD SAVING
$770–$1,180 per year per household
Savings for Everyday Households
A. Lower Electricity Bills
-
Faster renewable integration
-
More pumped‑hydro storage
-
Less reliance on expensive peaking gas
-
Fewer blackout‑related costs
Projected household saving:
$450–$650 per year
Lower Water Bills
-
More reliable supply
-
Less emergency trucking/desalination
-
Reduced drought‑response costs
-
Lower infrastructure duplication
Projected household saving:
$120–$180 per year
Reduced Flood & Drought Costs
-
Less property damage
-
Lower insurance premiums
-
Fewer emergency repairs
-
More stable food prices
Projected household saving:
$200–$350 per year

Savings for Businesses
A. Lower Energy Costs
-
Cheaper wholesale electricity
-
Fewer outages
-
More stable pricing
-
Lower diesel generator reliance
Projected business saving:
Small business: $2,500–$6,000 per year
Medium business: $15,000–$40,000 per year
Large industry: $1.2M–$4M per year
Lower Water Costs
-
Reliable supply for agriculture, food processing, manufacturing
-
Less drought‑related shutdown
-
Lower irrigation costs
Projected business saving:
Small business: $800–$2,000 per year
Agriculture: $20,000–$150,000 per year
Large water‑dependent industry: $300k–$1.5M per year
Reduced Supply‑Chain Disruption
-
Fewer flood‑related road closures
-
More stable freight costs
-
Lower spoilage and downtime
Projected business saving:
$3,000–$12,000 per year
TOTAL BUSINESS SAVING
Small business: $6,000–$20,000 per year
Medium business: $20,000–$60,000 per year
Large industry: $1.5M–$5.5M per year
Savings for Agriculture & Regional Australia
A. Water Reliability
-
Higher yields
-
Lower irrigation cost
-
Less crop loss
Farm saving:
$40,000–$200,000 per year
B. Energy Stability
-
Cheaper pumping
-
Cheaper cold storage
-
Cheaper processing
Farm saving:
$10,000–$60,000 per year
National-Level Savings Passed Down to People & Business
Civilian Only Model
-
Slow build
-
High overheads
-
Delayed benefits
-
Higher long‑term prices
Civilian + ADF Model
-
$6–8B lower cost
-
$13–15B higher benefit
-
$15–20B stronger net benefit
-
6–10 years faster delivery
These savings flow directly into:
-
lower bills
-
lower insurance
-
lower food prices
-
lower business overheads
-
stronger regional economies

COST TO UPGRADE COAL‑FIRED POWER STATIONS TO BE “CLEAN & GREEN”
It’s extremely expensive, technically limited, and still not truly clean.
Upgrading coal plants can mean several things:
-
Pollution control upgrades (SO₂, NOx, particulates)
-
Efficiency upgrades (supercritical/ultra‑supercritical retrofits)
-
Carbon Capture & Storage (CCS)
-
Co‑firing with biomass or hydrogen
Pollution Control Upgrades (SO₂, NOx, particulates)
Purpose: Reduce smog‑forming pollutants, not CO₂.
Cost per station:
-
$500M – $1.2B per plant
Outcome:
-
Cleaner local air
-
No reduction in CO₂
-
Does not make coal “green”
Efficiency Upgrades (Supercritical/Ultra‑Supercritical)
Purpose: Improve thermal efficiency by 5–10%.
Cost per station:
-
$1.5B – $3.5B
Outcome:
-
5–10% less coal burned
-
5–10% CO₂ reduction
-
Still emits millions of tonnes of CO₂ annually
-
Requires major boiler/turbine replacement
Carbon Capture & Storage (CCS)
Purpose: Capture CO₂ and store it underground.
Cost per station:
-
$2.5B – $4.5B upfront
-
$150M – $300M per year operating cost
-
Requires pipelines + geological storage
Outcome:
-
Captures 60–90% of CO₂ (never 100%)
-
Increases coal consumption by 20–30%
-
Extremely expensive
-
No commercial success in Australia to date
Biomass or Hydrogen Co‑Firing
Purpose: Replace part of the coal with “cleaner” fuels.
Cost per station:
-
Biomass: $300M – $800M
-
Hydrogen: $1.2B – $2.0B
Outcome:
-
Biomass: limited supply, not carbon‑neutral at scale
-
Hydrogen: requires massive renewable buildout
-
Still emits CO₂ unless 100% hydrogen (not feasible today)
How many coal stations do we really need with your backbone?
Think in three layers:
-
Firmed renewables (backbone core)
-
Solar + wind REZs
-
Pumped hydro (Snowy, Burdekin, inland PHES, Tas)
-
Battery hubs near cities and REZs
-
Strong transmission (north–south, east–west, northern arc)
-
-
Short‑term firming (batteries + hydro)
-
Handles hours to days of variability.
-
-
Legacy coal as transitional backup
-
Handles rare multi‑day events until storage fleet is big enough.
-
With that structure, you don’t need all existing coal plants—just a small subset:
-
By late 2020s: Keep maybe 6–8 big stations (or equivalent units) across QLD, NSW, VIC, WA as transitional backup.
-
By early–mid 2030s (with your backbone fully built): You can realistically be down to 3–5 big stations, running at low capacity factors (not 70–80% like the old days, more like 10–30%).
-
By late 2030s: 1–2 units as emergency reserve only, then full retirement as storage and interconnection fully mature.
This aligns with AEMO’s expectation that coal is “all but gone” from the main grid by the mid‑2030s, with the last units closing before 2040.